Results and Statistics
Analysis of data obtained for Sugar
When lime was used comparatively higher sugar production was observed than all the other treatments. Vateria and Careya showed a considerable reduction in the amount of sugar when compared to that of control. In all the treatments, amount of sugar produced increased with time. Higher amount of sugar was produced with lime, after 30 hours.
The distribution of data obtained for sugar showed normal distribution. Bartlett test confirmed that there is a good homogeneity of variances (Methodology). Residual plots between sugars and treatments were plot to check the normality of the distribution. Points are distributed relatively even below and above the line of zero value, in the first residual plot (Figure 14). This confirms that the distribution of the data obtained for sugar is good normal.
The distribution of data obtained for sugar showed normal distribution. Bartlett test confirmed that there is a good homogeneity of variances (Methodology). Residual plots between sugars and treatments were plot to check the normality of the distribution. Points are distributed relatively even below and above the line of zero value, in the first residual plot (Figure 14). This confirms that the distribution of the data obtained for sugar is good normal.
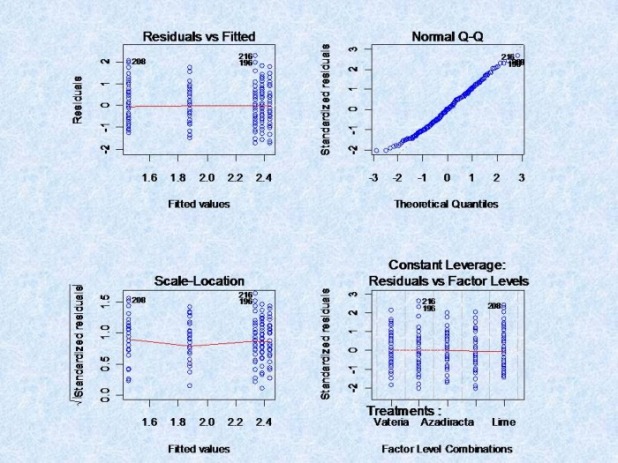
Figure 14 : Residual plots between the amount of Sugar and Treatments
One way anova was done for the analysis of variance.
H0: There is no significance difference among the levels of treatments.
H1 : There is some significance difference among the levels of treatments.
F value and the P values obtained for the treatments were 10.53 and 8.171e-09 respectively. (F value – 10.53,
P value – 8.171e-09)
Conclusion : As the p-value is lesser than the alpha level 0.05 ( 8.171e-09 - Table 2) , H0 is rejected, and H1 is accepted. ie, there is a significance difference among the level of treatments.
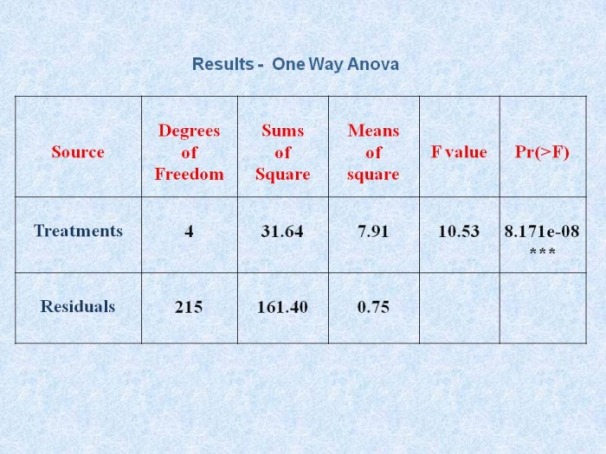
Table 2 : Results of One way Anova test for sugar (Analysis of variance table)
Pairwise T test (Tukey test) was done to see which pairs show significant difference from each other. Treatment combinations Vateria and Azadiracta, Lime and Careya and Vateria and Lime showed significant difference individually in the data obtained for sugar. Rest of the treatment combinations did not show significant difference (Table 3).
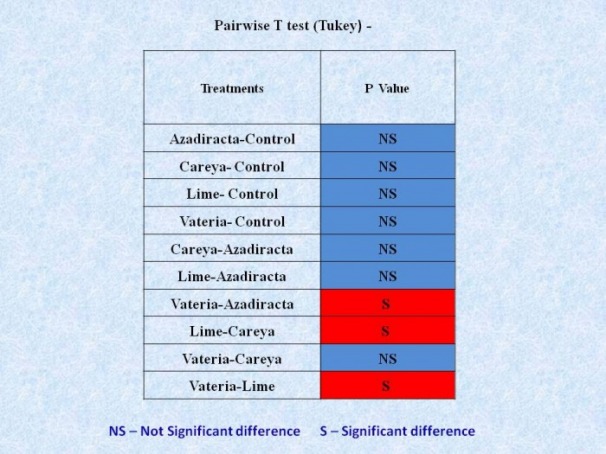
Table 3 : Results of the pair wise T test (Tukey) for the data obtained for Sugar
Red colour - Significance difference between the treatments
Blue colour - There is no significant between the treatments
Red colour - Significance difference between the treatments
Blue colour - There is no significant between the treatments
Among the treatments, Lime could be recommended for higher sugar production as the inhibition of sugar is significantly lower than the other substances tested except Azadiracta and control.
Analysis of Data obtained for Alcohol
The alcohol content of Palmyrah sap observed in Vateria copallifera, Careya arborea, Azadiracta and control were higher than that of Lime. The degree of inhibition of fermentation varies among the different substances used. In all the treatments, amount of alcohol produced increased with time, except control. Higher inhibition of fermentaion by lime might be due to the alkaline pH. At higher pH levels, the metabolic activity of most of the microbes will be inhibited. Therefore they cannot perform anaerobic respiration and the alcohol production also will be very low.
Data obtained for alcohol was not normal and the transformation also was not possible (Methodology). Histograms were plot to check whether the treatments are similarly distributed or not. Histograms showed that the treatments of alcohol are not similarly distributed (Figure 15).
Data obtained for alcohol was not normal and the transformation also was not possible (Methodology). Histograms were plot to check whether the treatments are similarly distributed or not. Histograms showed that the treatments of alcohol are not similarly distributed (Figure 15).
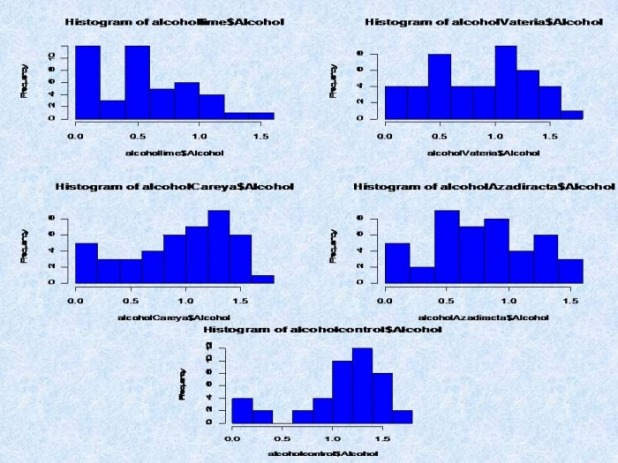
Figure 15: Histograms showing the distribution of treatments of alcohol
Therefore nonparametric tests were planned and Kolmogorov-Smirnov test was done to each pair of treatments seperately and the results are summarized in Table 4.
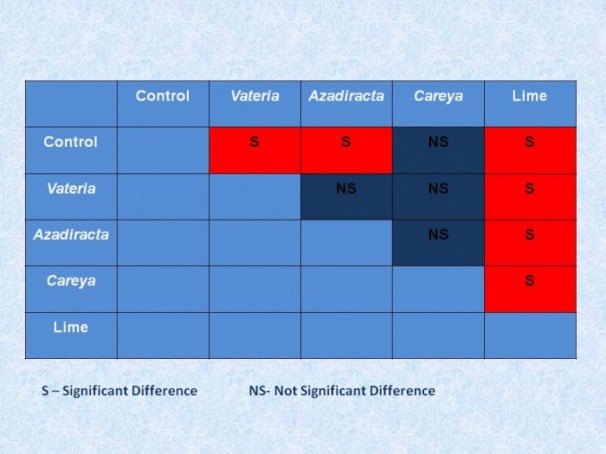
Table 4 : Results of Kolmogorov-Smirnov test showing whether there are significant difference between the
treatments of alcohol or not.
S - Significant difference (in Red) NS - Not Significant difference (in Blue)
treatments of alcohol or not.
S - Significant difference (in Red) NS - Not Significant difference (in Blue)
When Lime was used, there were significance differences in all the sets of treatments of alcohol. When Careya was used there were no significance differences in all the sets. Among the treatments, Lime could be recommended for higher inhibition of alcohol production as the inhibition of alcohol production is significantly higher with lime, than the other substances tested.
Analysis of data obtained for Bacteria
Based on the shaphiro test results, the data obtained did not follow normal distribution. Thus, the normality was not good. Therefore, transformation was done by three methods and they were not successful (Methodolgy). Histograms showed that the treatments of bacteria are not similarly distributed.
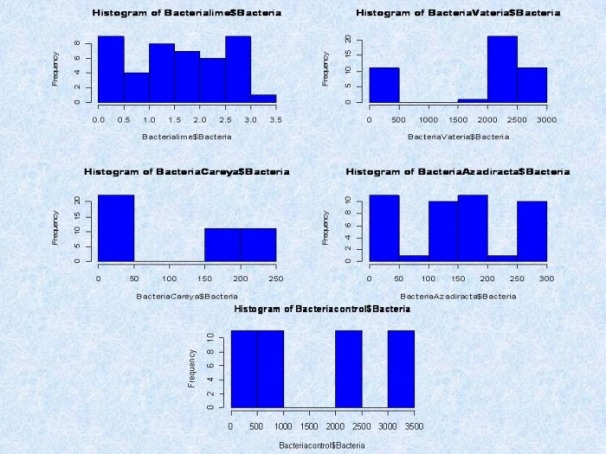
Figure 16 : Histogram showing the distribution of treatment of bacterial cells
Therefore, Kolmogorov-Smirnov test was done to each pair of treatments of bacteria seperately and the results are summarized in table 5.
Therefore, Kolmogorov-Smirnov test was done to each pair of treatments of bacteria seperately and the results are summarized in table 5.
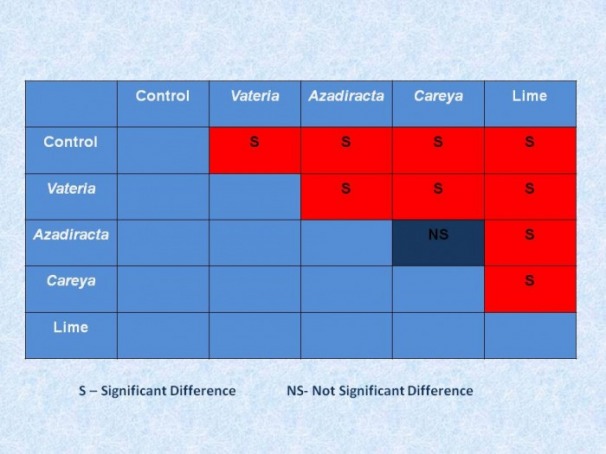
Table 5 : Results of Kolmogorov-Smirnov test showing whether there are significant difference between the
treatments of bacteria or not.
S – Significant difference (Red) NS – Not significant difference (Blue)
treatments of bacteria or not.
S – Significant difference (Red) NS – Not significant difference (Blue)
Analysis of data obtained for yeast cells
Shaphiro test showed that the data obtained did not follow normal distribution. Therefore, transformation was done by three methods and they were not successful (Methodolgy). Histograms showed that the treatments of bacteria are not similarly distributed. Therefore, Kolmogorov-Smirnov test was done to each pair of treatments of yeast seperately and the results are summarized in table 6.
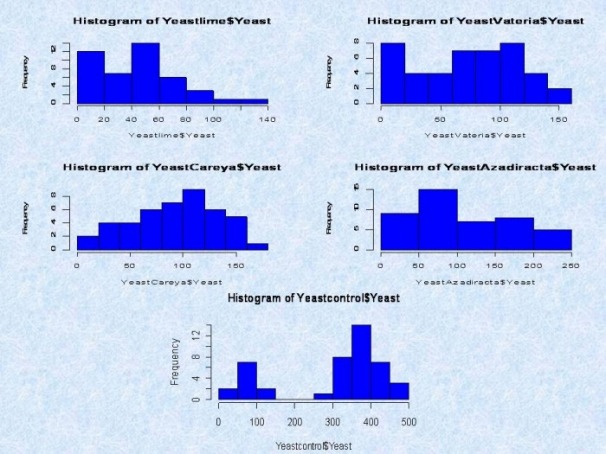
Figure 17 : Histogram showing the distribution of treatments of yeast cells
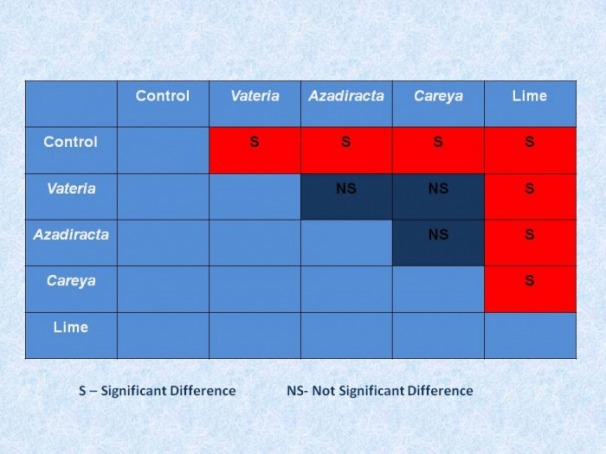
Table 6 : Results of Kolmogorov-Smirnov test showing whether there are significant difference between
the treatments of yeast or not.
S – Significant difference (Red) NS – Not significant difference (Blue)
Based on the analysis of results obtained for alcohol, sugar, bacteria and yeast, lime showed significant difference than all the other treatments tested except Azadiracta and control in sugar.
the treatments of yeast or not.
S – Significant difference (Red) NS – Not significant difference (Blue)
Based on the analysis of results obtained for alcohol, sugar, bacteria and yeast, lime showed significant difference than all the other treatments tested except Azadiracta and control in sugar.
