Methodology
Figure 5: Map of SriLanka and the northern peninsula, where the study was done.
The study area includes the City of Jaffna and the rural palmyrah palm growing area of SriLanka (Figure 5). To study the effect of lime, the inside of the collecting pot was lined with a thin coating of lime (10grams/Litre) before it was hung on the palmyrah tree. Pieces of fresh bark of Vateria copallifera and Careya arborea and leaves of Azadiracta at the rate of 10 grams were put in each case into the collecting pot (Volume - 3Litre) before use. Control was also maintained without the addition of any substances.
The samples were collected after 15 hours, 30 hours, 45 hours and 60 hours and analyzed in the laboratory for alcohol, reducing sugars, number of yeast cell and bacterial cells. Assay of sugars was done using reducing test with copper reagent. Alcohol present in the sample was bubbled into a mixture of K dichromate and H2SO4. The colour change in the dichromate solution was read colorimetrically (AOAC, 1984). The percentage of alcohol was then determined using standard calibration curve. Yeast cell counts were made by viable plate count on glucose peptone yeast extract agar medium, while bacterial cells were counted by the same method but on nutrient agar medium.
The samples were collected after 15 hours, 30 hours, 45 hours and 60 hours and analyzed in the laboratory for alcohol, reducing sugars, number of yeast cell and bacterial cells. Assay of sugars was done using reducing test with copper reagent. Alcohol present in the sample was bubbled into a mixture of K dichromate and H2SO4. The colour change in the dichromate solution was read colorimetrically (AOAC, 1984). The percentage of alcohol was then determined using standard calibration curve. Yeast cell counts were made by viable plate count on glucose peptone yeast extract agar medium, while bacterial cells were counted by the same method but on nutrient agar medium.
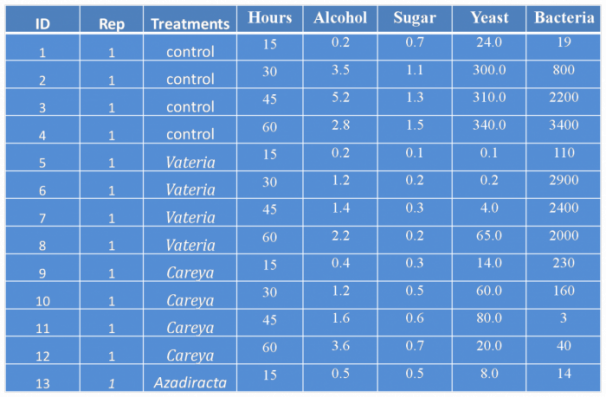
Table 1: Data table showing dependant and independent variables
Dependant variables - Alcohol, Sugar, Yeast & bacteria.
Independant variables - Treatments & Hours
Statistical Testing
Data obtained for Sugar
Shaphiro test was done to check whether the data obtained for sugar is normal or not. Based on the shaphiro test results, the data obtained follows normal distribution (P-value = 0.1284). Thus the normality is good. Therefore transformation of data was not needed. Bartlett test was done to test the equal variance. As the P value (0.6185) is greater than the alpha level (0.05) there is a good homogeneity of variances.
Data obtained for Alcohol
Shaphiro test was done to check whether the data obtained for Alcohol is normal or not. Based on the shaphiro test results, the data obtained did not follow normal distribution (P-value = 2.317e-06). Thus, the normality was not good. Therefore, transformation of data was needed. Transformation done by three methods (square root, log and inverse transformations) was not successful.
Data obtained for Bacteria
Based on the shaphiro test results, the data obtained did not follow normal distribution (P-value = 2.2e-16). Thus, the normality was not good. Therefore, transformation was done by three methods (square root, log and inverse transformations) and it was not successful.
Data obtained for Yeast
Shaphiro test showed that the data obtained did not follow normal distribution (P-value = 2.336e-16). Transformation done by three methods (square root, log and inverse transformations) was not successful.
